gClaudeTokenMonitor (ctm) is a terminal monitor that tails Claude Code's
session logs and refreshes token counts and cost every second.
Go standard library only — zero dependencies, a single exe.
Ships with a taskbar companion UI and 5-minute sampling of your official plan usage.
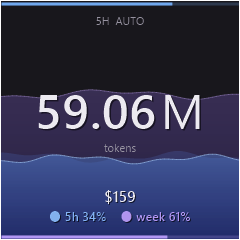
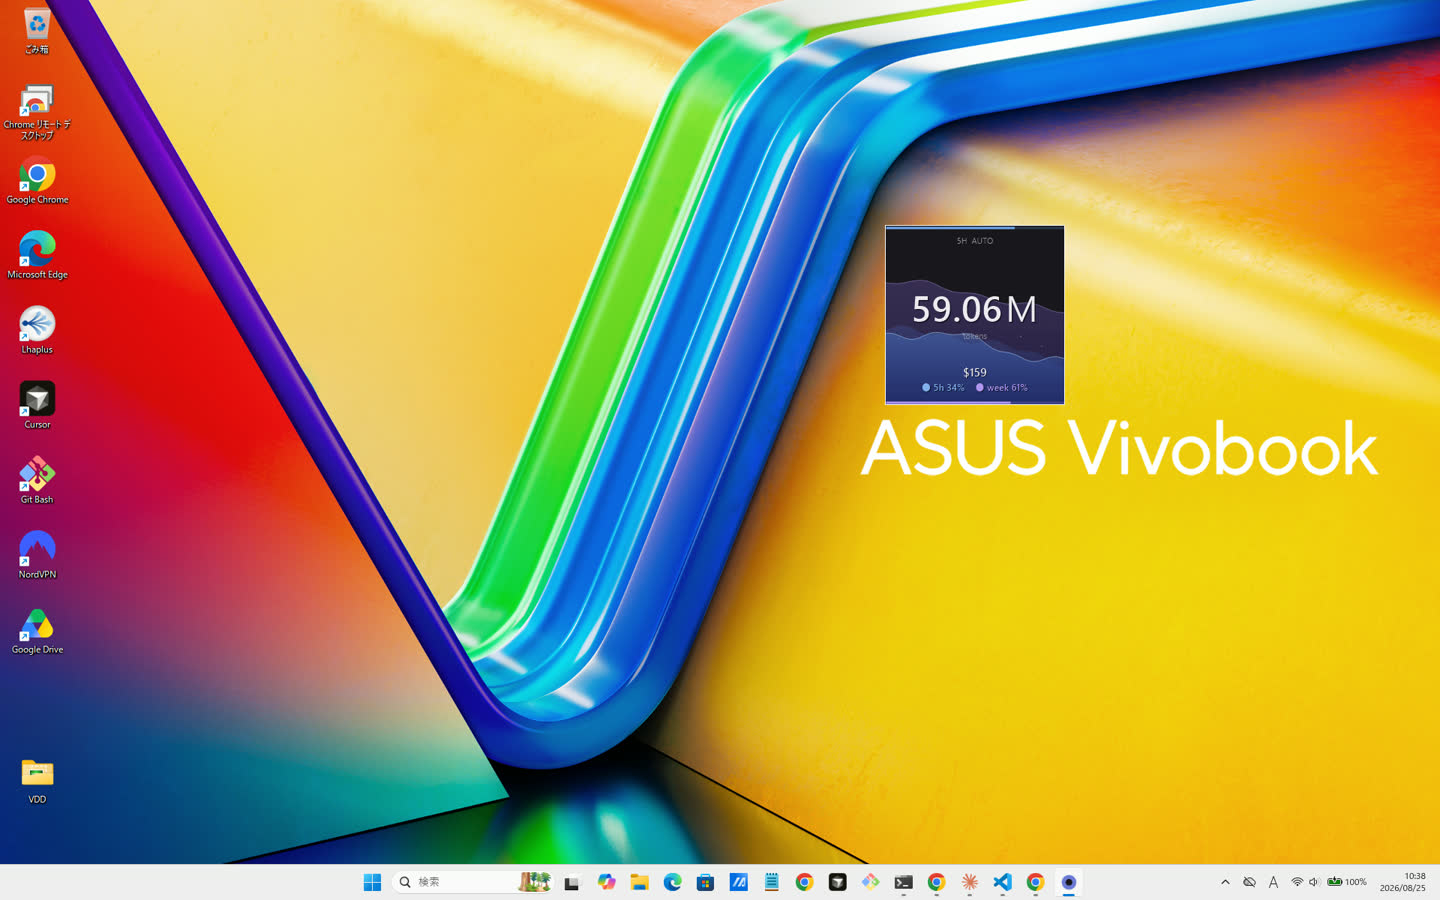
The always-on monitor window. Water level = plan usage.
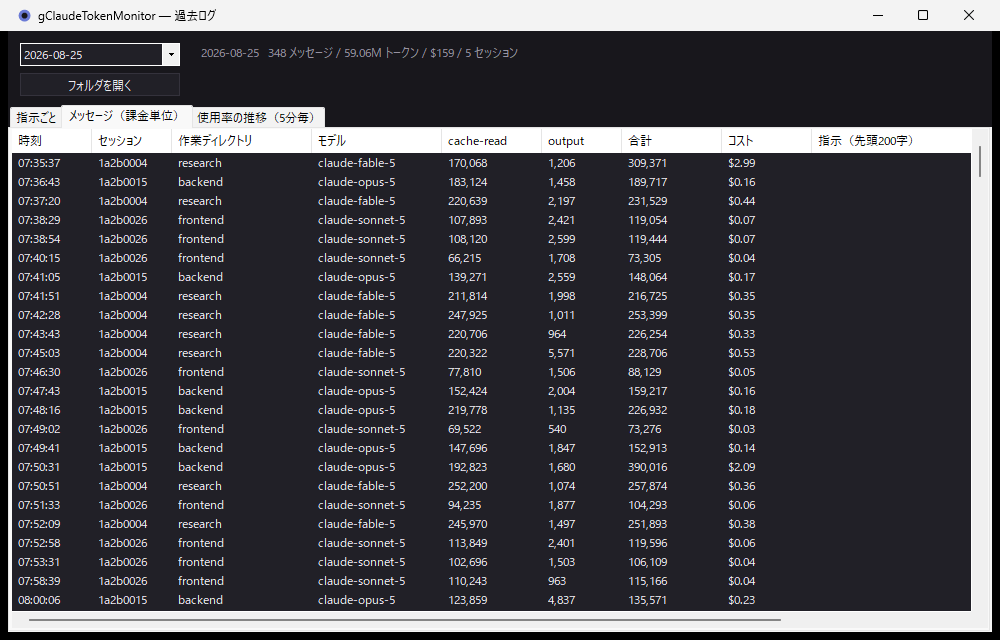
Numbers in the app screenshots on this page are synthetic demo data; the device photo and video show real readings.
WHAT IS THIS
It just reads the logs. No API key, no setup.
Claude Code already writes every session to ~/.claude/projects/**/*.jsonl.
ctm tails those logs and aggregates the usage of each assistant message.
It never touches the sessions being measured — zero observer effect.
Claude Code's logs write the same message multiple times (~1.7× inflation, measured);
ctm dedupes on message.id + requestId. Cache writes (5-minute and 1-hour)
and cache reads are priced at their real rates (1.25× / 2.0× / 0.1×).
DEMO 01 — TASKBAR
When the aquarium fills up, take a break.
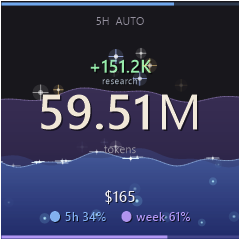
CtmMonitor is a small always-on-taskbar window. It draws your 5-hour limit
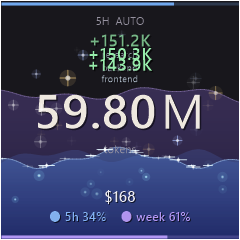
(front, blue) and weekly limit (back, purple) as a two-layer aquarium, and every burst
of consumption floats up as a +N particle tagged with the project that caused it.
Drag the window and the water sloshes.
Leave it running — the water rises at the edge of your vision
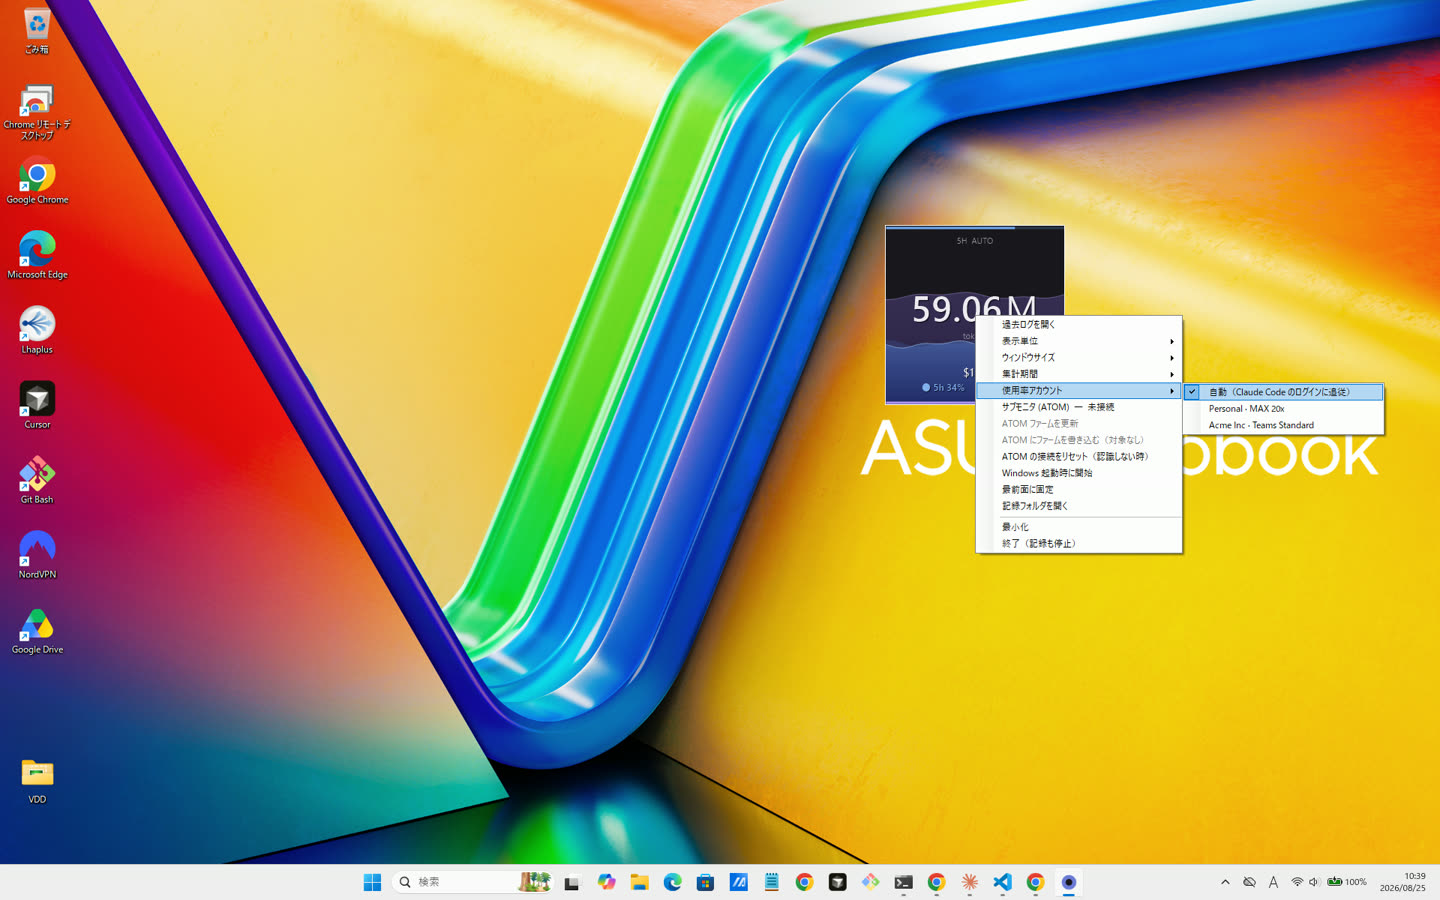
Right-click — switch usage account (personal MAX / work Teams)
Click to cycle display units (Auto / K / M / RAW) and layouts. Right-click → "Start with Windows" to keep it resident.
DEMO 02 — LIVE
Are we burning right now — and how long until the wall?
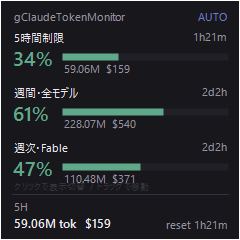
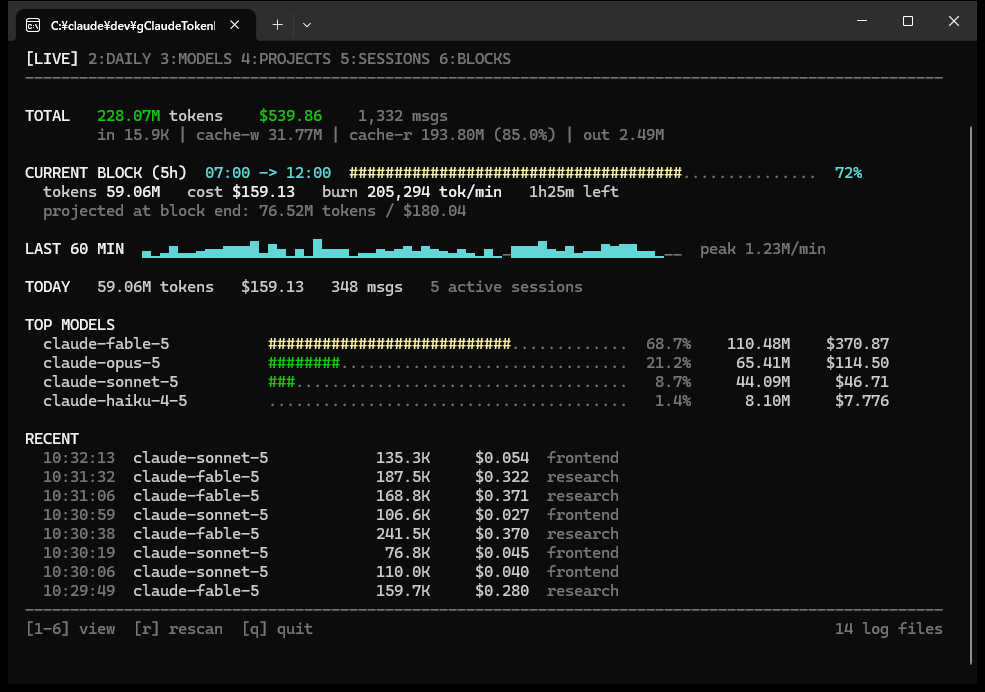
The CLI monitor, running in your terminal. Refreshes every second.
ctm auto-detects the 5-hour blocks that rate limits actually operate on,
and shows a progress bar, burn rate (tok/min) and a projection at block end.
The last 60 minutes render as a sparkline, so you can see exactly when the fire happened.
Refreshes every second. 1–6 switch views, r rescans,
q quits.
DEMO 03 — VIEWS
Six angles. One keystroke apart.
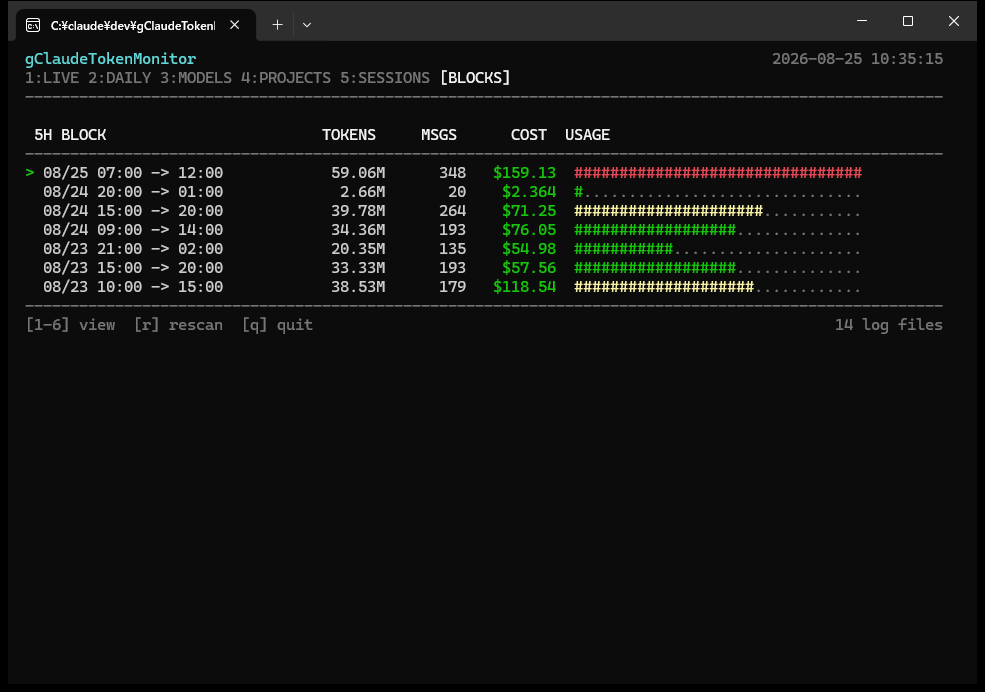
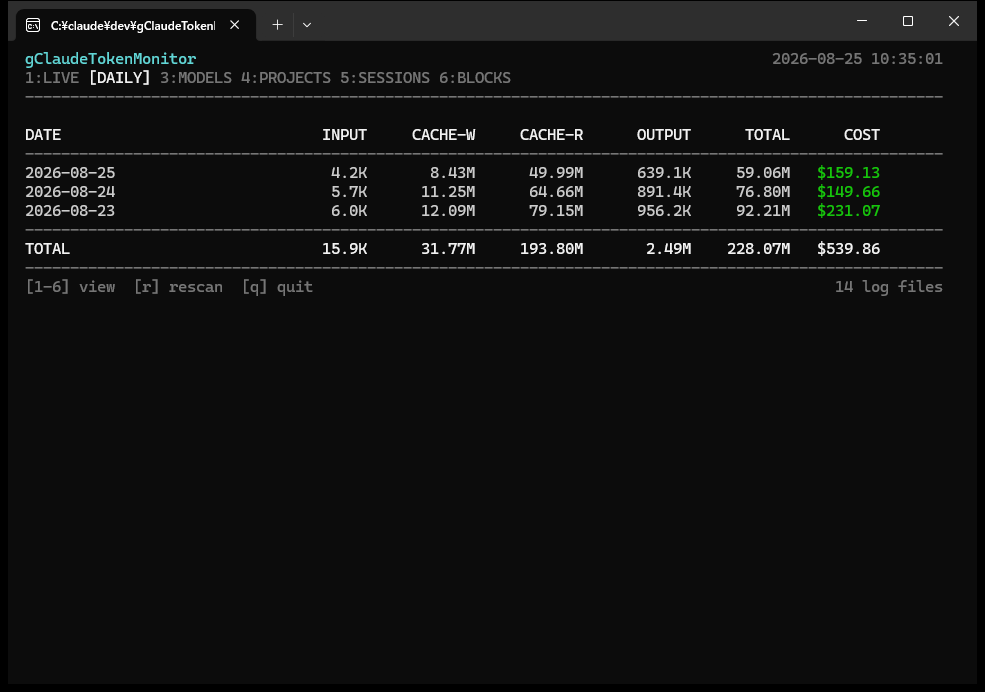
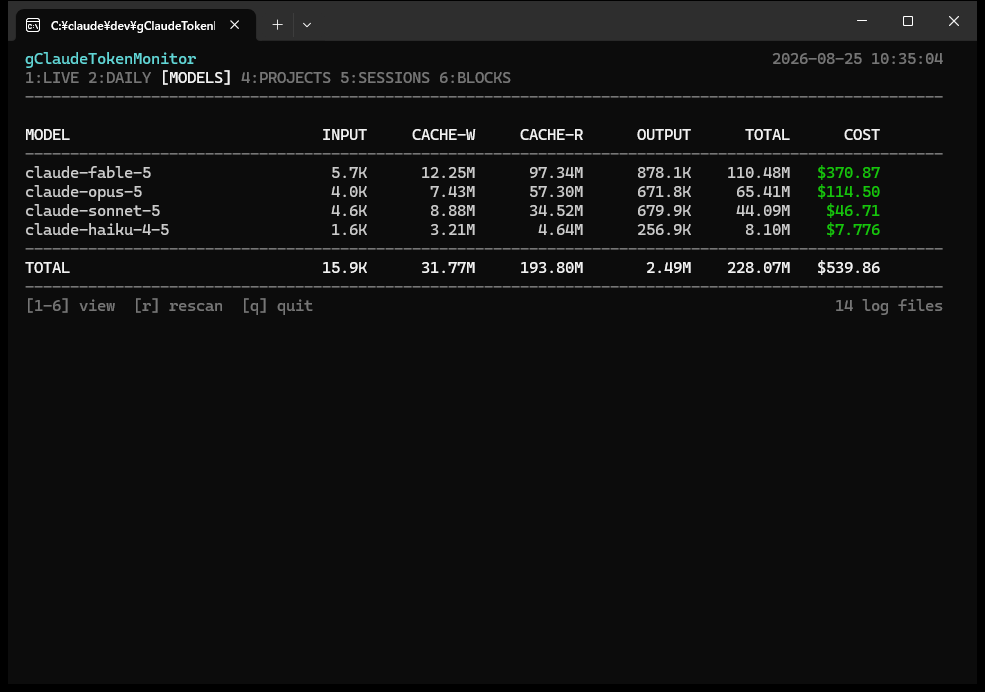
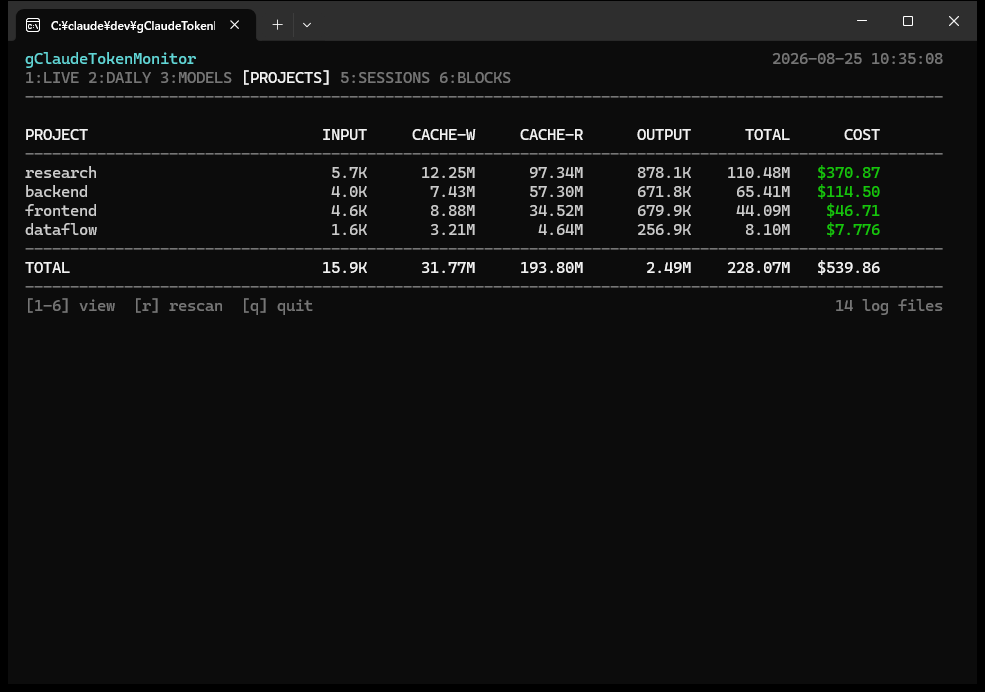
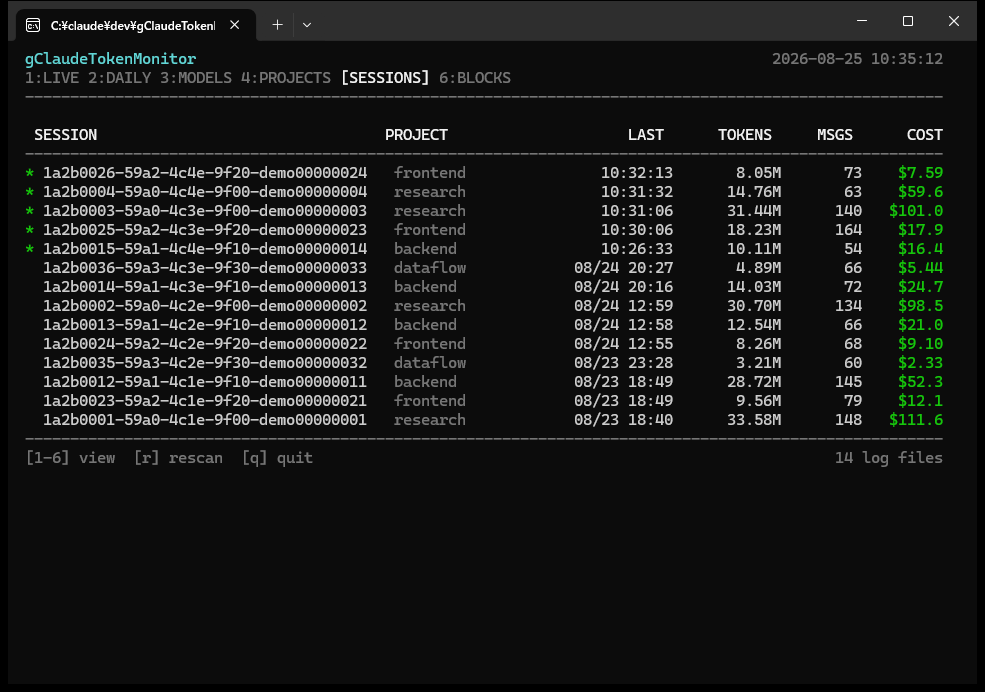
By day, by model, by project, by session, by 5-hour block.
"How much did yesterday cost?" "Which project is eating the budget?"
"Which sessions are alive right now?" — instant answers.
2: DAILY — per day, with cache breakdown and daily cost
3: MODELS — per model: fable / opus / sonnet / haiku share
4: PROJECTS — per project (cwd)
5: SESSIONS — per session; * marks activity in the last 30 min
DEMO 04 — SUB-MONITOR
A dedicated gauge on your desk.
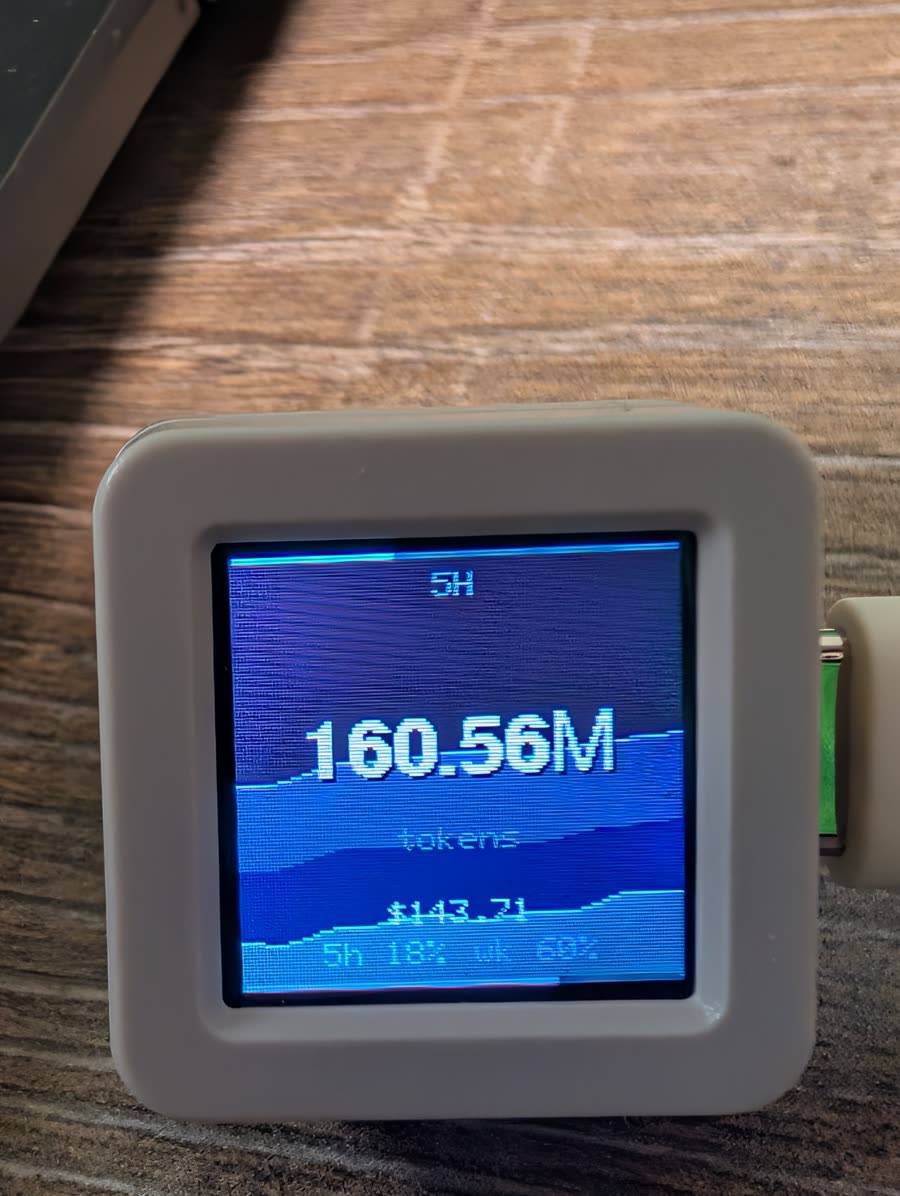
Use an M5Stack ATOMS3R (128×128 IPS, IMU) as a display-only sub-monitor.
CtmMonitor streams state over USB every 200ms; the device renders the two-layer aquarium
and spring counters at 30fps. Physically rotate the unit and the display rolls to follow
gravity.
Firmware flashing and updates happen from the app's right-click menu —
no esptool, no Python, no buttons on the device. The zip bundles the firmware
(atom-fw\): flash a brand-new unit as-is, and the "update" item only
lights up when the connected device is older than the bundled build (it never
rewrites anything on its own).
Live demo — tilt the unit and the water pools toward the lower side; the IMU tracks gravity so the tank obeys physics
ATOMS3R — tokens, cost and plan usage for the 5h window, always on your desk
DEMO 05 — ALWAYS-ON
Stop "preparing to measure". It's already measured.
The resident recorder ctm record archives every session into
~/.ctm/, append-only. However many Claude Code windows you open,
whenever you start a new session — it's recorded, no configuration.
Measuring becomes slicing a time range after the fact:
●●● ctm query
$ ctm query -from "13:00" -session 1a2b3c4d
Survives reboots by resuming from byte offsets (no gaps, no double counting).
The UI's history window drills down to per-prompt breakdowns.
DEMO 06 — PLAN LIMITS
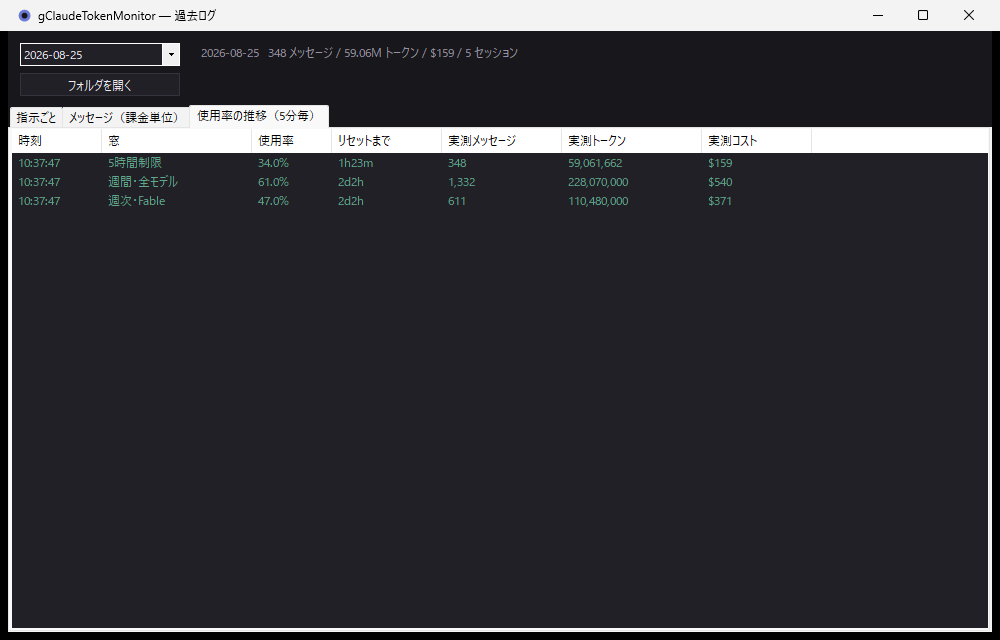
Official usage % and measured burn, on the same line.
Usage history — the official % and what it cost, on one row
ctm fetches the official usage percentages Claude Code shows for your
5-hour and weekly limits, and records them next to what ctm measured in the same window.
Knowing "at X% we had consumed Y" lets you reverse-engineer the window capacity.
●●● ctm limits
$ ctm limits

plan usage limits  max / default_claude_max_20x

  5-hour limit
   usage     0.0% ............................
   resets    in 4h55m (08-22 20:09)
   measured  7 messages / 3.28M tokens / $2.074

* weekly - all models
   usage     8.0% ##..........................
   resets    in 106h45m (08-27 01:59)
   measured  1,036 messages / 275.44M tokens / $231.58
   capacity  3.44G tokens / ≈ $2895 (implied from this reading)
   left      ≈ $2663
Sampled every 5 minutes by the resident recorder. With multiple machines, the asymmetry
— % is account-wide, measurements are per-machine — even lets you estimate what your
other machines are burning.
FEATURES
Feature checklist
Dedup — message.id + requestId (without it you overcount ~2×)
Incremental reads — byte offsets; partial lines carried to the next tick
Cache-aware pricing — 5m/1h writes and reads at their real rates
5-hour block detection — the actual rate-limit window, with history
Burn rate & projection — linear extrapolation from the last 5 minutes
-session new — meter only a session you're about to start
-since-now — meter only from this moment on
ctm query — slice the archive by time range; detects active work clusters
Official usage recording — 5h / weekly % next to measured burn
JSON output — pure ASCII, script-friendly (PowerShell / jq)
Crash auto-recovery — the UI supervises the recorder and restarts it with evidence
ATOMS3R sub-monitor — a desk-top USB display (shipped since v0.2.0, flashed from the menu)
VS
Compared with the usual ways
Claude Code's /cost etc.
Run-on-demand usage CLIs
ctm
Real-time display
current session only
✕ (only when you run it)
◯ 1s refresh, across all sessions
Always-on recording
✕
✕
◯ resident recorder (append-only)
Setup before measuring
none
run it each time
none — already recorded, slice later
Cross-check with official %
% only
✕
◯ % and measured burn on one line
Per-cache-type pricing
—
depends on tool
◯ 5m/1h/read split (20× price spread)
Install
—
may need a runtime
unzip only, zero dependencies
Costs are estimates at Anthropic's public list prices. On flat-rate plans (Pro / Max) no actual billing occurs.
INSTALL
Install (just unzip)
Two prerequisites: the PC uses Claude Code (ctm reads its logs), and — only if you
want plan-usage percentages — you are logged in to claude.
No Go, no .NET, no Python to install.
If SmartScreen blocks it: right-click the exe → Properties → check "Unblock" → OK. On PCs with Smart App Control enabled, downloaded unsigned exes are blocked with no override
(since v0.1.1 the block is surfaced via a balloon and crash.log). Build from source instead: